
“Show me your flowcharts and conceal your tables, and I shall continue to be mystified. Show me your tables, and I won’t usually need your flowcharts; they’ll be obvious.” – Fred Brooks
Flowcharts are a great tool to use for communicating several steps in a given process. From easy to complex charts, this method of organization breaks down each step into actions and decisions.
“A flowchart is a visual representation of the sequence of steps and decisions needed to perform a process.”
– Smartdraw
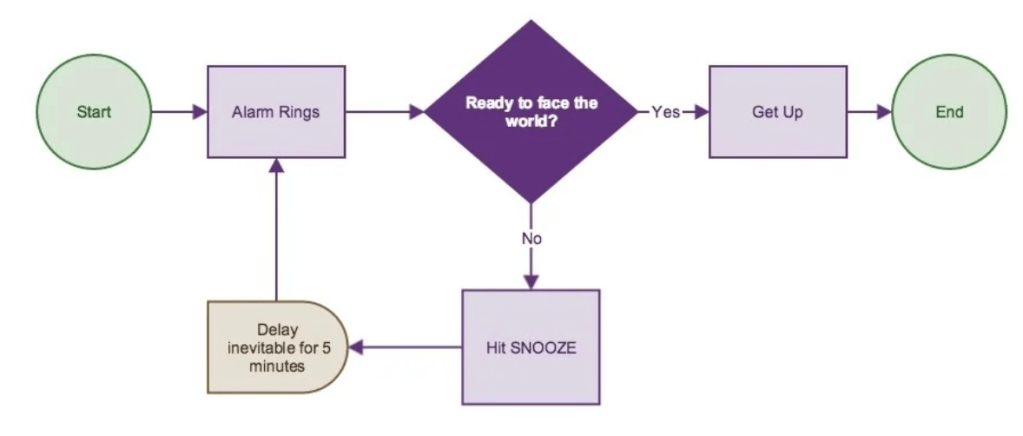
When creating a flowchart, there are three main shapes to help break down the information. An elongated circle symbolizes the start of the process. Next, a rectangle stands for instructions or actions. Lastly, a diamond represents where a decision needs to be made. In between each shape, there are arrows to represent the flow of the process.

Lastly, it is important to ask questions like, “What happens next?”, “Is the process complete?”. This ensures that all steps are cover and all of the information is complete.
Getting Started
A few weeks ago, I created an Information Architecture (IA) for my hometown’s website. IA is a great way to break down information, and in my case, layout the current navigation and information on the present site. I completed the site’s current condition and then recreated my own version of what I think the site should look like. I then refined the information once again to fit a mobile app.


The name of the app, Merrimack, is simple and straightforward. Information for visitors and government will mostly be limited to the desktop and browsers online. The purpose of the app is directed at residents and businesses of Merrimack. There will be information, sign-up forms, reporting options, and many more activities for both users.
Before I can start using flowcharts, I need to create a few user scenarios and stories to accompany the charts.
User Stories & Scenarios
Nicole
As a new resident, I want to know the best locations in town on my smartphone, so I don’t have to make more than one trip.
Nicole is a new mom that just moved to Merrimack to raise her family. She needs to find the best route in order to get all of her errands done in one trip, so she doesn’t need to leave the house multiple times. Nicole wants to see all of the businesses in Merrimack and see a map of their location.
Greg
As a resident, I need to sign my kids up for fall/winter/spring sports on my smartphone, so I don’t have to borrow my wife’s computer every time.
Greg has lived in Merrimack for the last eight years. Every season he has trouble locating the Merrimack Youth Association (MYA) sports sign-ups page for his three kids. Greg wants a quick and easy way to sign up his kids for each sport.
Joanne
As a business owner, I am looking to expand my store and need to find the correct information on my smartphone, so I don’t have to research when I’m off the clock.
Joanne has been a business owner and resident of Merrimack for three years. She has never expanded her store before and is looking for a quick way to get all the information she needs to develop her current location without moving to a new one.
Flowcharts
Now that I have all the information I need, it’s time to start making the flowchart.
My first step was to imagine myself as the hypothetical user. Then, I wrote down the logical steps they would take when navigating the app. I kept asking myself, what happens next?
The first flowchart, Nicole, was challenging at first. I had everything written down and sketched out, but I was having a hard time strategically placing the information so everything could connect. I looked at some of my notes on flowcharts and remembered consistent branch direction, uniform spacing, and scaling. By the time I got to the final flowchart, Joanne, I felt more confident.
Nicole

Greg

Joanne

Conclusion
I saw myself struggling with the flowcharts because I felt like I could continue them forever. I was in the driver’s seat and dictated how many steps each user had to take in order to finish their task. I had to challenge myself to keep realistic standards and make sure the hypothetical user stayed on track.
Overall, user scenarios, stories, and flowcharts helped me see the perspective of an average user. It gave me more ideas to add to my design, such as sub-navigation, to the app’s structure.

Leave a comment