
This week I will be discussing the different types of information visuals explained by Scott Berinato in his book Good Charts: The HBR guide to making smarter, more persuasive data visualizations. The combination of the nature (conceptual/ data-driven) of the design and the purpose (declarative/ exploratory) of the data creates four possible combinations for a potential data visualization; conceptual-declarative, conceptual-exploratory, data-drive-declarative, and data-driven-exploratory.
Nature
- Conceptual: Ideas/ Simplify/ Teach
- Data-Driven: Statistics/ Inform/ Enlighten
Purpose
- Declarative: Documenting/ Designing
- Exploratory: Prototyping/ Interactive
Conceptual-Declarative
Conceptual-Declarative uses simple, metaphorical visualizations to explain complex topics. These charts are useful when explaining topics such as the Stages of Grief by Elizabeth Kubler-Ross.
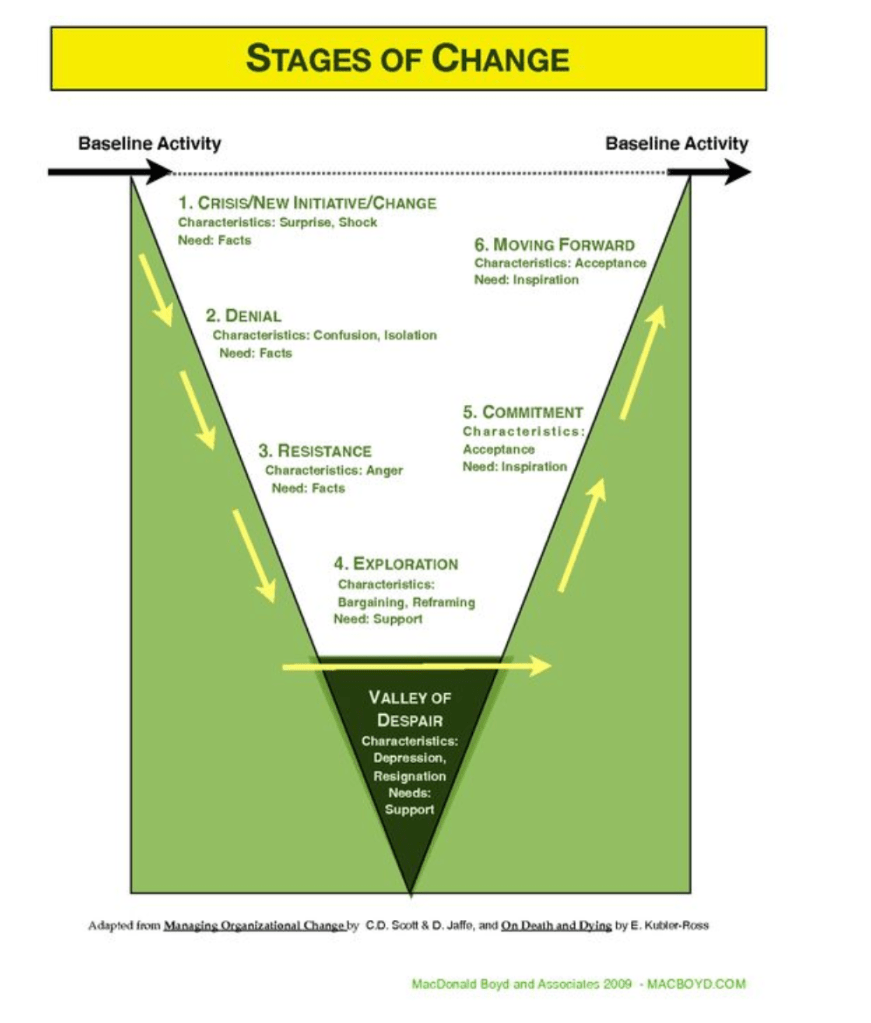
The goal of these visuals is to learn and simplify information to get the main result of a topic. It is effective because it makes information more manageable.
The topic of grief is intimidating. When listing the stages, it is easy to think of the negative instead of the positive. This graphic shows that these is an equal downward and upward trajectory during grief.
Conceptual-Exploratory
Conceptual-Exploratory visuals are ideas that are written on something like a piece of paper, a whiteboard, or a napkin. These drawings are used to help create a flow of ideas. Using conceptual-exploratory visualizations in meetings or conferences as a team-building exercise as well.

This visualization aims to discover and learn about new ways of thinking or to explore a topic in detail. It is effective because it “aims to find answers to nondate challenges,” (Berinato, 60).
This visual shows the process of designing and sketching of some sort of bedroom. I chose this example to show the progression of though as this person tries to solve the issue of space and placement of the furniture in the bedroom.
Data-Driven-Declarative
Data-Driven-Declarative are clear, simple, and don’t show too much data. These visualizations are perfect in a business setting to demonstrate upward or downward trends. They are also good for generating questions about the data and not the chart itself.
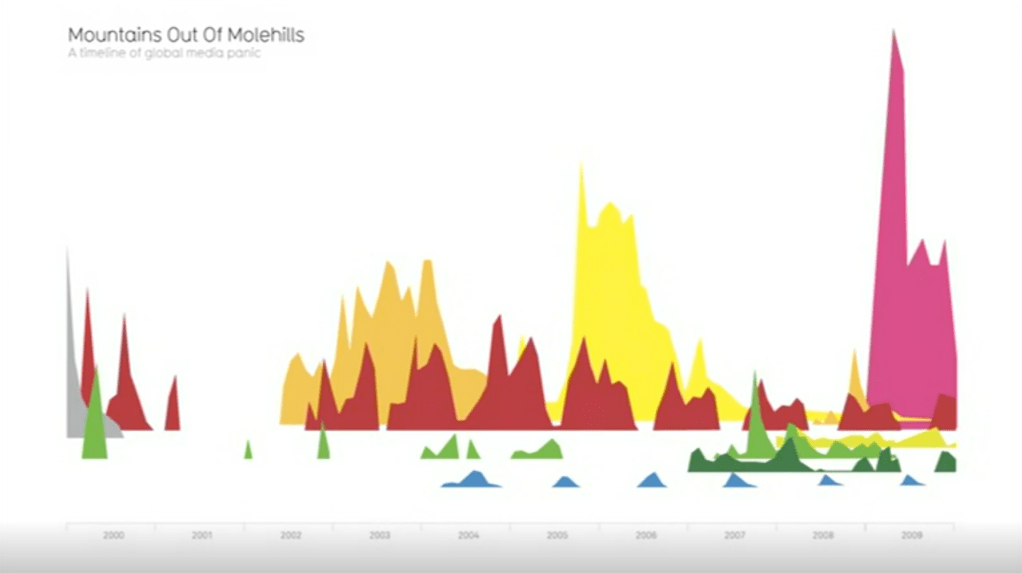
The goal of these visualizations is to declare established data. It is effective because it tells a story and presents clear information is a quick and visual way.
Here is a visualization taken from a TedTalk by David McCandless on media panic from 2000 to 2009. The back row shows fears of illnesses, the green signifies fears of astroid collisions, and the blue in the front is the fear of killer wasps. An interest trend to note is the red peaks that show the fear of violent video games. The trends spike in November (before the Holiday season) and April (anniversary of the Columbine shooting). McCandless discusses these trends in more detail, but this simple, data-driven graphic shows patterns in a quick and visual manner.
Data-Driven-Exploratory
Data-Driven-Exploratory is the most complicated out of the four visualization types. These are the charts and graphs that you see in PowerPoint presentations.
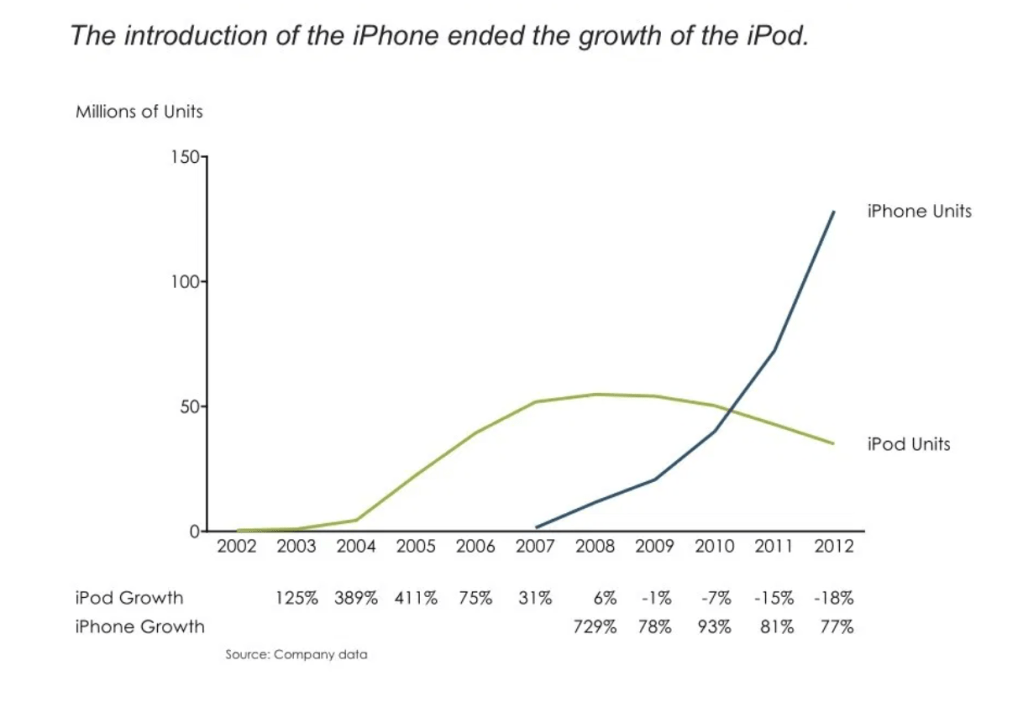
The goal is to spot trends and to reflect deeply on the information being shown. It is effective because this visual presents a data set in a simplified manner.
This data set shows the trends of iPhones vs. iPods. It is taking millions of units and breaking them down across several years to show that Apple put one of its own product out of business.
Resources
Berinato, S. (2016). Good charts: The HBR guide to making smarter, more persuasive data visualizations. Boston, MA: Harvard Business Review Press.
Crick, S. (2019, June 02). Types of Visuals and When to Use Them. Retrieved July 17, 2020, from https://shelleycrick.com/types-of-visuals-and-when-to-use-them/

Leave a comment