
Category: Data Visualization
-
Hurricanes and Climate Change
Hurricanes are mighty storm systems that produce powerful winds, heavy rainfall, and extensive damage. These storms vary depending on size, strength, and speed. Weather experts divide these storms into 5 different categories. How they work Hurricanes form over warm ocean waters in the Atlantic. The water on the surface of the ocean is evaporated by…
-
Dear Data Reflection

Dear Data For the past couple of weeks, I have collected small data sets about the books I own (and have not read yet), my Animal Crossing habits, and how long I use my iPad every day. Without the conscious effort of collecting data, I would have never noticed the trends and insights that I…
-
Brainstorming a Data Story

This week I came up with a few ideas for a data story. This method of storytelling uses visuals with data to help convey a story. Edward Tufte, in his book, Beautiful Evidence, points out that creating a visual presentation with data is a “moral act as well an in intellectual activity” (Tufte, 141). He warns…
-
Dear Data #2 – Animal Crossing
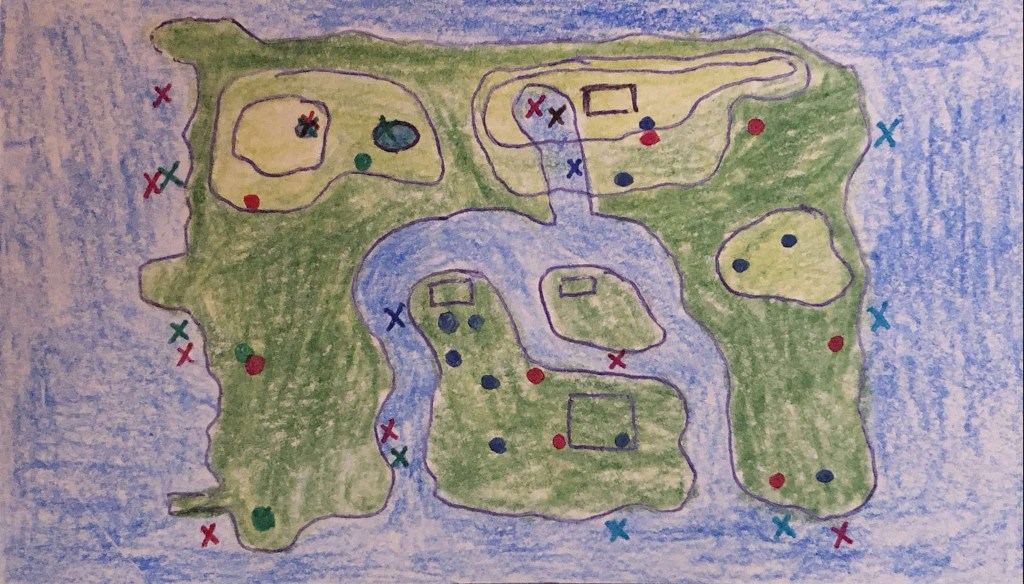
About: This visualization represents the collection of bugs and fish that I gathered over the course of five days while playing Animal Crossing: New Horizons on my Nintendo Switch Lite. Note: I play Animal Crossing every night right before I fall asleep. I usually only play for 10-15 minutes or so to help me relax.…
-
Maps and Charts

Now that I’ve learned about datasets, it’s time to figure out how to create the visuals. This week I took a look at the online data visualization tool, Datawrapper to create some colorful and informative maps and charts. I had many successes and failures while using the software. It is very easy to use, but…
-
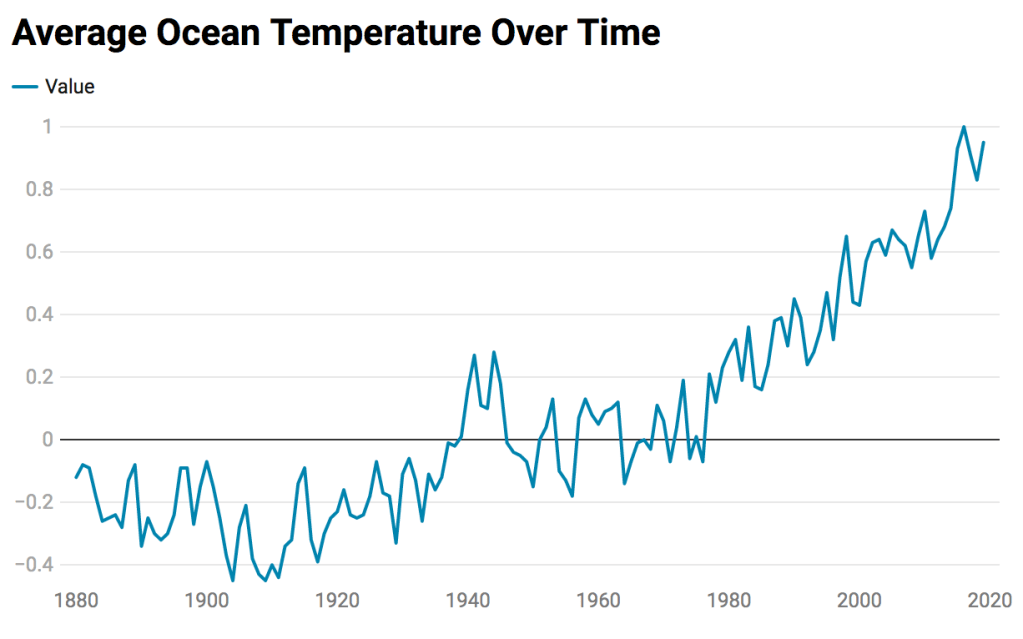
Data Sets

This week I started to look past beautiful visualizations and look at the raw information that inspired them in the first place, the data. From simple to complex data sets, it is critical to communicate the information in an effective manner. If the data is lacking, it could lead to misleading or questionable conclusions. These…
-
Dear Date #1 – Books
About: This is a representation of every book that I have not read on my bookshelf in alphabetical order. Note: I am a very fast reader, and will probably read most of these books by the end of the year. I was also listening to an audiobook while creating this visual. Tools: pen/ index card/…
-
Four Types of Visualizations
This week I will be discussing the different types of information visuals explained by Scott Berinato in his book Good Charts: The HBR guide to making smarter, more persuasive data visualizations. The combination of the nature (conceptual/ data-driven) of the design and the purpose (declarative/ exploratory) of the data creates four possible combinations for a potential…
-
An Introduction to Data Visualization

What is data visualization? Data visualization is a representation of information in a visual manner. This could be as simple as a chart describing the clothes in your closet, or as complicated as showing the rate of homelessness in various cities across the United States. The complexity level depends on the amount of data and the representation…
-
Is Knowledge Still Power?

The use of smartphones has changed our ability to acquire knowledge. When almost everyone has access to the Internet, is knowledge still powerful?
