
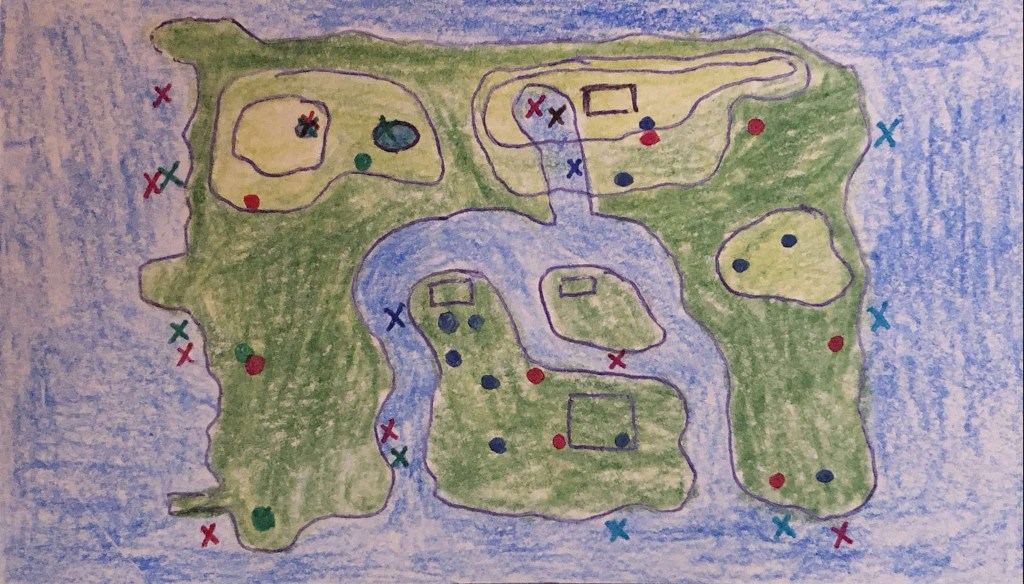

About: This visualization represents the collection of bugs and fish that I gathered over the course of five days while playing Animal Crossing: New Horizons on my Nintendo Switch Lite.
Note: I play Animal Crossing every night right before I fall asleep. I usually only play for 10-15 minutes or so to help me relax. If I have time on the weekends, I will spend several hours collecting bugs and decorating my island. I did not want to record on these days because I did not want to disrupt the data. What you see here is an accurate representation of how many bugs and fish that I collect in an average week.
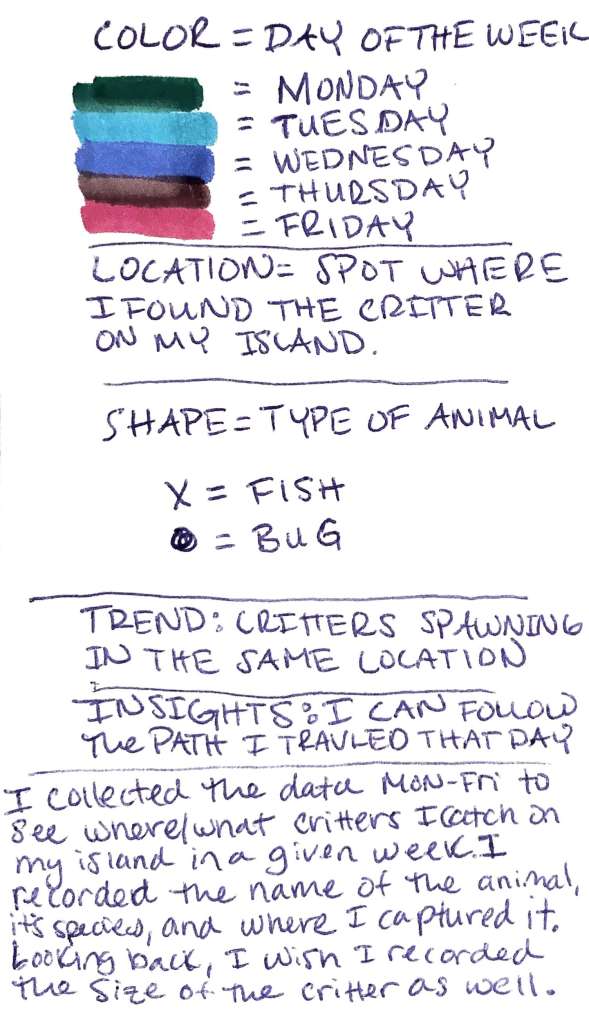
Trends: While trying to spot reoccurring areas, I noticed that it was easy to spot the fishing respawn locations, the the bug hotspots are still hard to pinpoint.
Insights: Going forward, I know of several different fishing locations to try before the next fishing tournament! It was also interesting to look closing at the visualization and follow the path that I took that day.
Going Forward: Next time I record a dataset from my experience while playing Animal Crossing, I would like to add the size, color, and shape of each critter. I would also see if I could add the time of day and success rate of catching the critter as well. Or instead of looking at the data from a location point-of-view, I could see it as terms of quantity. How many total fish did I catch? How many bugs?

Leave a comment