

This week I started to look past beautiful visualizations and look at the raw information that inspired them in the first place, the data. From simple to complex data sets, it is critical to communicate the information in an effective manner. If the data is lacking, it could lead to misleading or questionable conclusions. These bad visualization are now under the umbrella of fake news. But there is hope. According to Omar Elgabry, by looking at the informations validity, accuracy, completeness, consistency, and uniformity we can spot quality data.
Below are a few data sets that I found on Statista. I plan to use this data to practice making visualizations.
Global Social Media Users
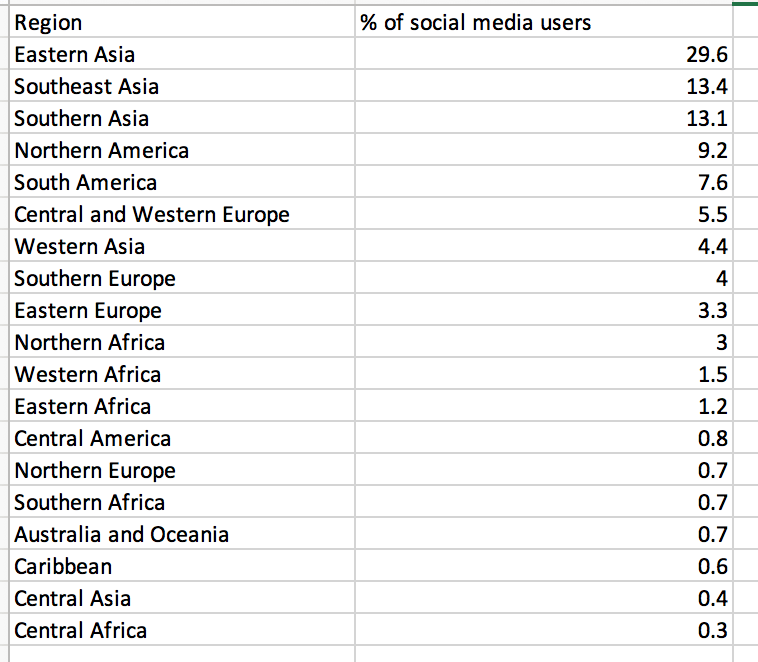
- Description: This is a global analysis of social media users based on population.
- Task:
- Compare percentage based off of subregion
- Compare percentage based off of region
- Identify most popular regions
- Identify least popular regions
- Possible chart types: vertical bar graph/ map
- To make this visualization more trustworthy, I will add the population of each subregion to the final graphic. I will also use a color gradient to create a simple visual indicator of subregions with little social media usage vs. the most popular subregions. This will keep the data consistent and uniform.
North America Box Office
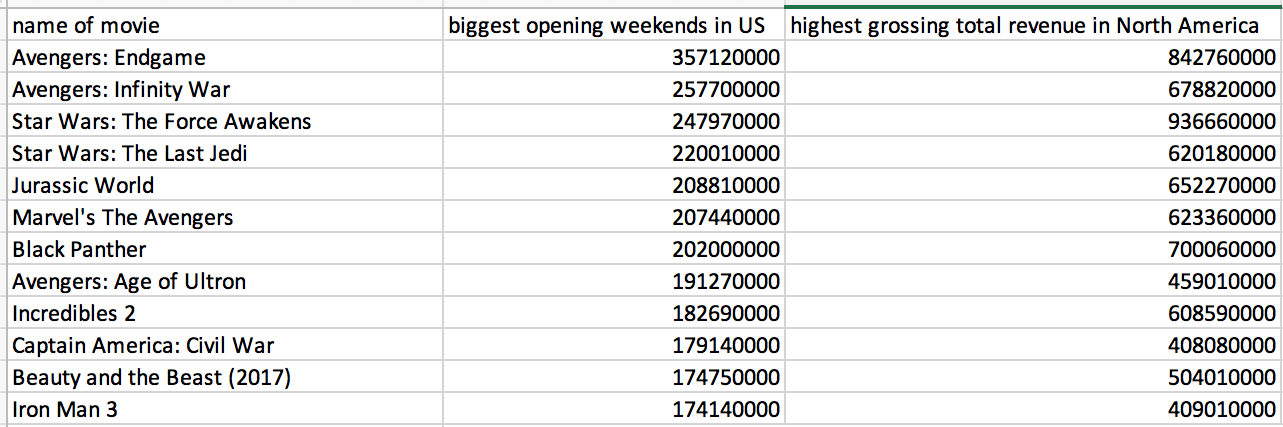
- Description: Here are two data sets that show the revenue of some of the most successful movies in history.
- Task:
- Compare revenue of most successful opening weekends vs. total revenue
- Is there a relationship between a successful opening weekend and total revenue?
- Possible chart types: variable width chart/ bar chart
- To make this visualization more trustworthy, I will create clear and appropriate labels to insure there is no confusion with the data. My visualization will start from 0 USD and extend all the way to 1 billion USD in order to not be misleading.
Book Sales
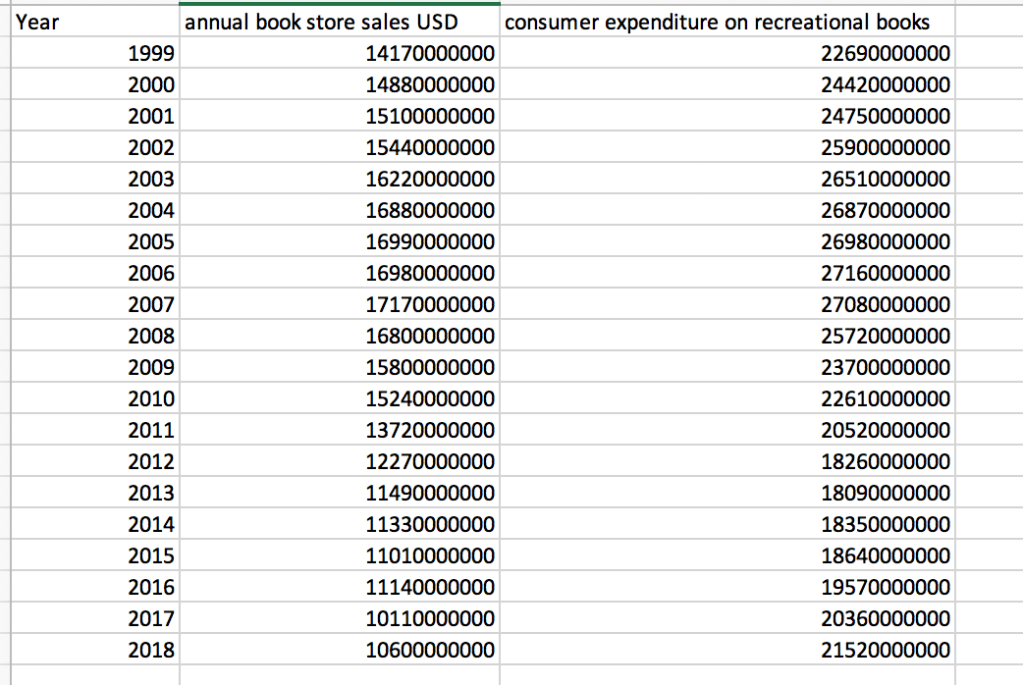
- Description: This shows two data sets of money spent on books over 19 years.
- Task:
- Compare revenue of book store sales vs. recreational book sales.
- Does the trend of increasing and decreasing book sales reflect the purchases of recreational books?
- Possible chart types: line chart/ bar chart
- To make this visualization more trustworthy, I will create clear, appropriate labels and correct use of color to insure there is no confusion with the data. I will start my visualization at 0 USD and extend all the way to 300 billion USD in order to be transparent and complete with the data.
Resources:
Clement, J. (2020, July 15). Social media: Regional distribution worldwide 2020. Retrieved July 25, 2020, from https://www.statista.com/statistics/295619/regional-distribution-of-social-media-users-worldwide/
Elgabry, O. (2019, March 02). The Ultimate Guide to Data Cleaning. Retrieved July 25, 2020, from https://towardsdatascience.com/the-ultimate-guide-to-data-cleaning-3969843991d4
Watson, A. (2019, August 09). Highest grossing 3D movies in North America 2019. Retrieved July 25, 2020, from https://www.statista.com/statistics/348870/highest-grossing-3d-movies/
Watson, A. (2019, October 15). Consumer expenditure on recreational books in the U.S. 2018. Retrieved July 25, 2020, from https://www.statista.com/statistics/192861/consumer-expenditures-on-recreational-books-in-the-us/
Watson, A. (2019, October 29). Biggest opening weekends at the North American box office 2019. Retrieved July 25, 2020, from https://www.statista.com/statistics/188498/biggest-opening-weekends-at-the-north-american-box-office/
Watson, A. (2020, April 15). U.S. book store sales 2019. Retrieved July 25, 2020, from https://www.statista.com/statistics/197710/annual-book-store-sales-in-the-us-since-1992/
Written by Emma Charlton, S. (n.d.). Fake news: What it is, and how to spot it. Retrieved July 25, 2020, from https://www.weforum.org/agenda/2019/03/fake-news-what-it-is-and-how-to-spot-it

Leave a comment