
Information visualization is designed to help us make sense out of data. It can be used to explore relationships between data, to confirm ideas we hold about data or to explain data in easy to digest manner.
Information Design Foundation
There are many elements that go into a data visualization. Shape, color, orientation, and textures are just some of the graphic elements that help us understand these visualizations. But sometimes, there are other creative ways to express data.
Inspired by Sarah Illenberger, I used books as an alternative way to represent data. Illenberger takes everyday objects and uses them to represent data. These visualizations are more memorable than a normal bar graph.
Below is a visualization of the literary genres that make the most money. Since this data is about book sales, I decided to represent each genre by its separate book stack that represents how much money each one makes.
My favorite part of the photo is the relationship between Children/ YA and Romance/ Erotica. I think this visual does a great job showing how popular and successful the romance genre is.
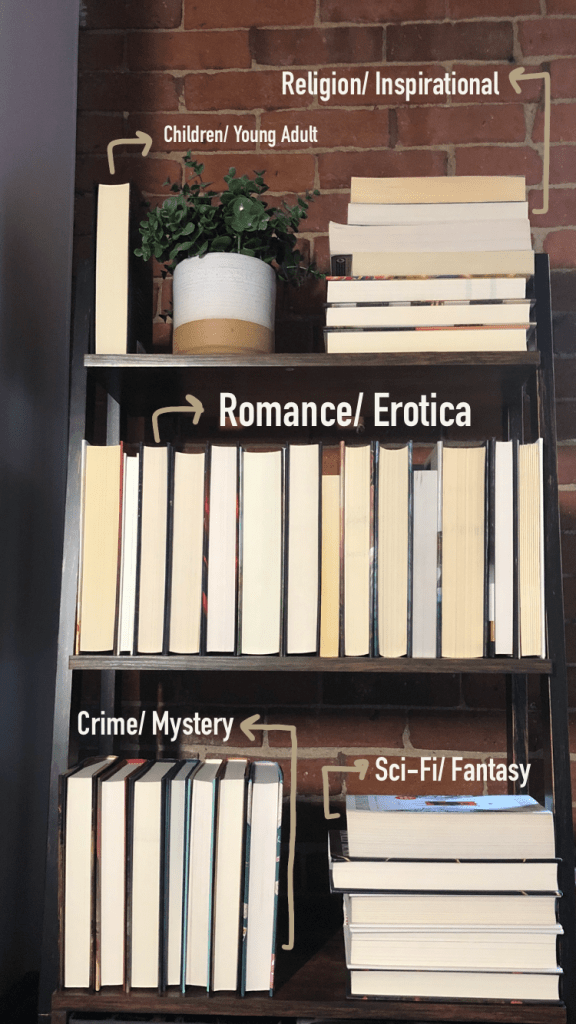
Crime and Mystery ($728.2 million)
Religious/Inspirational ($720 million)
Science Fiction and Fantasy books ($590.2 million)
Children and Young Adult ($160 million)
For this photo, my goal was to create a clear message that used materials relevant to the subject matter. I was going for a similar look of a bar graph, while also trying to be unique.
Hugh J. Watson, a professor of MIS, warns again using too much decoration in visual designs. Because of this, I was hesitant to add the plant on the top row, but I wanted to balance out the bookshelf instead of leaving an empty space. I wanted to the image to be casual, but still mean something.
Overall, I wanted to convey a visual story that presented the information like Sarah Illenberger, but put my own personal spin on it. Even thought the photo might not be of the best quality, but I learned how to present a set of data in an unconventional way.
Resources
DATA VISUALIZATION 101: HOW TO DESIGN CHARTS AND GRAPHS. (n.d.). Retrieved from https://cdn2.hubspot.net/hub/53/file-863940581-pdf/Data_Visualization_101_How_to_Design_Charts_and_Graphs.pdf
Information Visualization – A Brief Introduction. (n.d.). Retrieved September 11, 2020, from https://www.interaction-design.org/literature/article/information-visualization-a-brief-introduction
Kiniulis, M. (2020, August 14). 29 Book Sales Statistics, Facts, and Trends in 2020. Retrieved September 11, 2020, from https://www.markinblog.com/book-sales-statistics/
Sinar, E. (2016, February 15). 7 Data Visualization Types You Should be Using More (and How to Start). Retrieved September 11, 2020, from https://medium.com/@EvanSinar/7-data-visualization-types-you-should-be-using-more-and-how-to-start-4015b5d4adf2
Timeline. (n.d.). Retrieved September 11, 2020, from http://datavis.apps01.yorku.ca/milestones/index.php
Visual Mapping – The Elements of Information Visualization. (n.d.). Retrieved September 11, 2020, from https://www.interaction-design.org/literature/article/visual-mapping-the-elements-of-information-visualization
Watson, H. (2017). Data Visualization, Data Interpreters, and Storytelling. Retrieved from https://learn-us-east-1-prod-fleet01-xythos.s3.amazonaws.com/5df1cdd432f98/3100991?response-cache-control=private%2C%20max-age%3D21600&response-content-disposition=inline%3B%20filename%2A%3DUTF-8%27%27WatsonDataVisualization.pdf&response-content-type=application%2Fpdf&X-Amz-Algorithm=AWS4-HMAC-SHA256&X-Amz-Date=20200911T180000Z&X-Amz-SignedHeaders=host&X-Amz-Expires=21600&X-Amz-Credential=AKIAZH6WM4PL5SJBSTP6%2F20200911%2Fus-east-1%2Fs3%2Faws4_request&X-Amz-Signature=d1e4af276ebc34630d471b1c481afb7f89ace168cb4598e484b68a03e542d516

Leave a comment